Key Takeaways
- Isopach maps show thickness of sedimentary layers, aiding oil and gas exploration.
- They help identify areas with optimal extraction potential and influence drilling decisions.
- Investors should evaluate isopach maps for insights on reserve size and drilling cost.
Definition
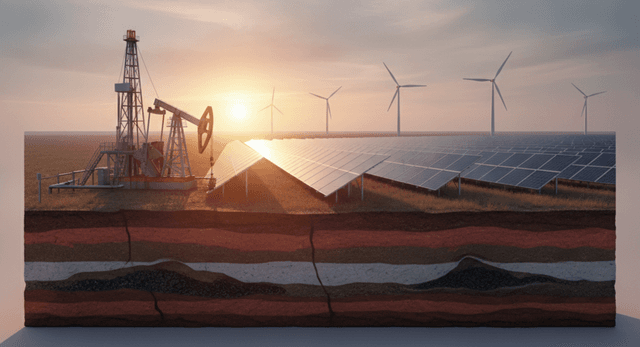
An isopach is a contour line on a map that connects points of equal thickness within a particular rock layer or stratigraphic unit. These maps are used in geology to represent the thickness of sedimentary deposits, often measured in meters or feet. They are essential in oil and gas exploration to determine the extent and volume of hydrocarbon reservoirs.
To create an isopach map, geologists collect data on the thickness of rock layers using methods such as drilling cores or seismic surveys. The collected thickness data points are then plotted to produce a visual representation of variation across a geographical area.
Isopachs are predominantly used in oil, gas, and mining industries to identify areas where resources are concentrated and economically viable for extraction. They is central to informing decisions on where to focus exploration and drilling efforts.
In simple terms, an isopach map shows how thick a particular rock layer is across different parts of a region.
Significance in Energy & Investing
In the oil and gas industry, isopachs help pinpoint locations with the maximum potential for resource extraction such as oil and gas reservoirs. By mapping layer thickness, these visual tools assist companies in optimizing drilling locations and understanding the distribution of deposits. This directly impacts operational efficiency by allowing companies to focus their resources on areas with high return potential.
The thickness of rock layers influences the quantity of recoverable resources. For instance, a thicker shale deposit might indicate substantial shale oil or gas reserves, offering significant extraction opportunities. Isopach maps are crucial during the planning and development phases of drilling projects and can adjust to specific asset types like drilling rigs and extraction technologies.
In terms of regulatory framework, agencies such as the Energy Information Administration (EIA) consider geological assessments, including isopach maps, when monitoring resource estimates and production forecasts. A practical example involves shale gas fields, where operators utilize these maps to better delineate thick shale deposits to facilitate economical drilling operations.
Implications for Investors
For investors, isopach maps are a valuable tool for assessing the potential size and viability of oil and gas reserves. Companies with access to areas denoted by thicker layers often experience more efficient resource extraction, leading to stronger revenue generation and healthier cash flows. Evaluating such maps can reveal insights into capital expenditures necessary for extraction and forecast possible operations costs.
Public market investors should review geological assessments disclosed in regulatory filings, which might include isopach maps. These documents help investors understand the resource potential and calculate projected production rates, influencing company valuation and dividend stability.
Direct investors in mineral rights, royalties, or working interests must understand how isopach maps affect lease profitability and operational costs. Pay particular attention to Lease Operating Expense (LOE) reports, as variations in layer thickness can significantly affect extraction costs.
A common misconception is that all thicker layers automatically translate to higher yields. While thickness is a factor, other geological properties and permeability must also be considered to evaluate extraction feasibility.
Investors should be cautious of any ambiguities or omissions concerning layer thickness in company filings, which could indicate less reliable resource predictions or higher risk.