Key Takeaways
- California's natural gas prices reached historic lows in early 2026 due to a combination of elevated storage inventories and declining demand from gas-fired power generation. For energy investors, the development underscores the importance of monitoring regional supply-demand fundamentals, storage levels, and energy transition trends that can influence commodity pricing independently of national benchmarks.
Introduction
California's natural gas market experienced an unusual development during the first months of 2026, with regional gas prices dropping to some of the lowest levels ever recorded. The decline reflects a combination of abundant storage inventories, changing electricity generation patterns, and weaker demand for natural gas-fired power generation.
According to data highlighted by the U.S. Energy Information Administration (EIA), benchmark natural gas hubs across California reported significantly lower spot prices during the first five months of 2026. Northern California's PG&E Citygate and Southern California's SoCal Border Average reached record-low monthly averages, while SoCal Citygate prices approached historic lows as well.
For energy investors, the development offers insight into how regional supply-and-demand fundamentals can diverge from broader national energy market trends.
Why Are California Natural Gas Prices Falling?
One of the primary drivers behind the oil price decline is the substantial amount of natural gas currently held in storage throughout the Pacific region.
Natural gas storage acts as a buffer between supply and demand. When inventories remain well above historical averages, market participants often have less urgency to purchase additional gas, placing downward pressure on prices.
Recent storage data shows Pacific-region inventories consistently exceeding normal seasonal levels since late 2025. By late May 2026, storage volumes were more than 30% above the region's five-year average. Such elevated inventories create a well-supplied market environment and reduce concerns about near-term shortages.
Table 1: Key Factors Behind California's Lower Natural Gas Prices
Factor | Market Impact |
Above-average storage inventories | Increased supply availability and reduced price pressure |
Lower natural gas-fired electricity demand | Reduced consumption from power generators |
Growth in solar generation | Less need for gas during daylight hours |
Expansion of battery storage | Reduced gas demand during evening peak periods |
Stable regional supply conditions | Limited upward pressure on spot prices |
How Is the Power Sector Affecting Natural Gas Demand?
California's electricity sector has undergone significant changes over the past several years. Increased deployment of solar generation and battery storage systems has altered the state's power demand profile.
Historically, natural gas plants played a major role in balancing electricity demand, particularly during peak periods. However, growing renewable energy generation has reduced reliance on gas-fired facilities.
Battery storage has become especially important. By storing excess solar energy produced during daylight hours and releasing it later in the day, batteries help meet evening electricity demand that previously required additional natural gas generation.
As a result, statewide natural gas consumption for power generation has continued to decline. EIA data indicates California consumed approximately 4.8 billion cubic feet per day (Bcf/d) of natural gas during 2025, representing a decline from the previous year and marking one of the lowest consumption levels on record.
For investors, this trend highlights the ongoing interaction between traditional energy infrastructure and emerging energy technologies.
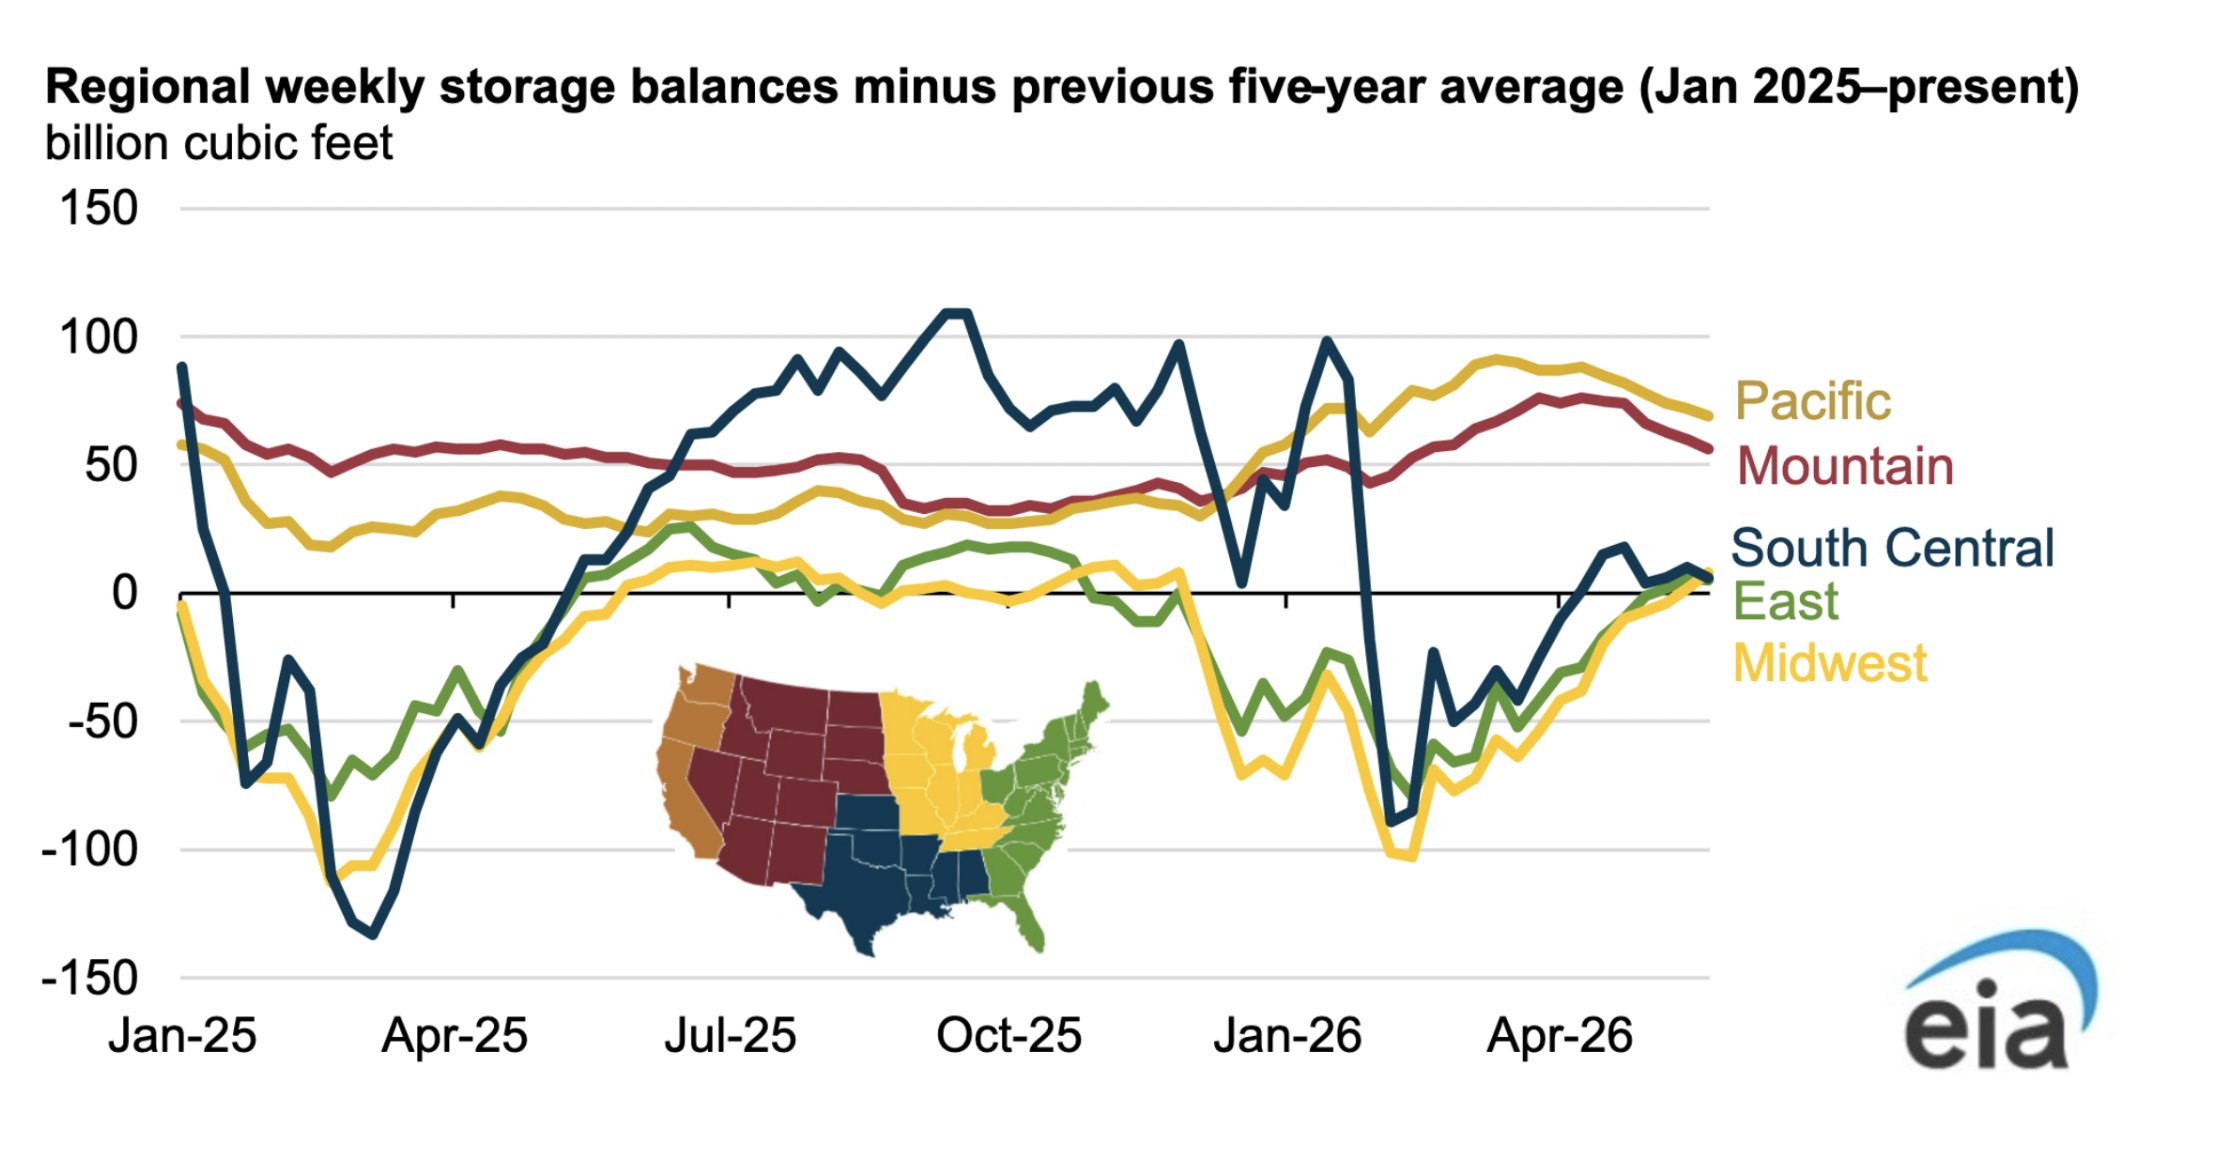
Image Source: Energy Information Administration
Why Is California Trading Below Henry Hub?
The Henry Hub benchmark serves as the primary reference price forre natural gas in the United States. California gas markets have historically traded at a premium to Henry Hub due to pipeline constraints, regional supply considerations, and localized demand dynamics.
In 2026, however, the situation has shifted.
The combination of high regional storage levels and weaker demand has pushed California hub prices below Henry Hub for extended periods. In some cases, the discount reached levels not previously observed since pricing data began being collected for certain regional hubs.
Although price spreads have narrowed somewhat during recent months, California gas prices continue to trade below the national benchmark.
Table 2: California Natural Gas Market Signals for Investors
Market Indicator | Potential Investor Interpretation |
Record-low regional prices | Weak near-term pricing environment |
Elevated storage levels | Well-supplied regional market |
Falling gas-fired generation | Structural demand shifts in electricity markets |
Expanding battery deployment | Increased competition for gas peaking plants |
Below-Henry Hub pricing | Regional market oversupply conditions |
What Does This Mean for Energy Investors?
The recent price weakness illustrates how regional energy markets can behave differently from national benchmarks. While Henry Hub remains the dominant pricing reference across the United States, localized conditions such as storage inventories, infrastructure constraints, and electricity demand can create substantial pricing differences.
For investors evaluating natural gas infrastructure, pipelines, storage assets, utilities, and power generation companies, California provides a useful case study in the impact of energy transition trends on regional commodity markets.
Lower natural gas demand does not necessarily indicate declining energy consumption overall. Instead, it reflects changing generation sources and evolving grid management strategies. As renewable energy and battery storage continue to expand, regional natural gas demand patterns may continue to evolve.
At the same time, natural gas remains a critical component of grid reliability and electricity generation, particularly during periods when renewable output is limited. Investors should therefore view the current market environment as part of a broader transition rather than a simple replacement of one energy source by another.
You can review the original analysis and supporting data directly through the U.S. Energy Information Administration.
